Excel Overview
ROWS: Each row in the spreadsheet is an individual respondent.
COLUMNS: Each column represents the fields associated with a respondent’s survey session. This includes individual responses to questions as well as any meta-data related to that survey session. Typically each question accounts for a column, listed in sequential order. Meta-data includes information such as respondent ID and time entered into a survey.
Sample Excel output:
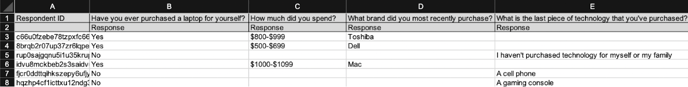
By reading from left to right, you can see that the first respondent has purchased a laptop for themselves, spent $800-$999, and bought a Toshiba laptop.
WHY IS DATA MISSING? AHHH BRANCHING!
Many surveys have logic in them the sends respondents down different branches of questions based on prior responses. As a result, a respondent may leapfrog past certain questions, leaving blank cells in your data output.
Above, there are blanks in columns C and D for respondents who have never purchased a laptop for themselves. The blanks in the output denote that these respondents were not exposed to those questions.
OUTPUTS VARY BY QUESTION TYPE
Different question types may present differently in your data output. While Single-Select questions account for one column, Multi-Select questions, depending on your output setting within your survey tool, may generate a column for each possible response choice.
Sample Multi-Select response output (one column per response option):
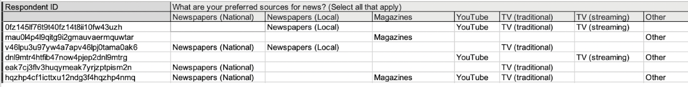
Reading from left to right, we can see that the first respondent gets their news from a combination of local newspapers, YouTube videos, TV (traditional), and TV (streaming).
If you have further questions about how to interpret your dataset, please reach out to your project manager and they would be happy to assist you.